Week 2
Hello, everyone
It seems to be a nightmare when I am required to confront with the math and statistics again due to they are not my cup of tea. However, a good attitude would motivate me to review them again.


Have you ever experienced making repeated measurements of what the same physical quantity, but the results were not always the same answer?
It seems to be a nightmare when I am required to confront with the math and statistics again due to they are not my cup of tea. However, a good attitude would motivate me to review them again.
First of all, to recall my memory, I need to look in a big picture to connect the
idea of the statistics as the figure below.

In this week we are
required to learn the four keywords consisting of measurements, errors,
confidence, and probability. It is undeniable that measurements are used in
everyday life and we are used to the unit of measurement or System International
(SI). According to Steven’s theory, On the Theory of Scales of Measurement. These
scales seem to measure the latent variables in social sciences such as
attitudes, symptoms, personality, health literacy. The 4 scales of measurements
are described in this theory. Personally, I called “NOIR” for the short form
for helping me remember them.
Scales
|
Basic
characteristics
|
Example
|
Nominal
|
A scale that measures data by name only. By the
numbers given are not identified their values, but we use the numbers as a
symbol of the things.
|
-
Nationality
-
Gender
-
Marital
status
-
Sex
-
ethnic
|
Ordinal
|
A scale that measures by rank order only. we cannot
measure the
exact difference in numerical terms.
|
-
satisfactory
of the services in AA hospital (excellent, fair, poor)
-
order of
birth-order of sibling
-
level of
education
-
IQ
levels
-
Social
class
|
Interval
|
Any scale that reflects only magnitude but does not
contain equal intervals or an absolute zero
|
-
Attitudes
-
Opinion
-
Temperature
|
Ratio
|
Similar to an interval scale, a ratio scale includes
a 0 measurement that
signifies the point at which the characteristic
being measured vanishes
(true zero). |
-
No
patients in the clinic
-
Income
-
Length
-
weight
|
Have you ever experienced making repeated measurements of what the same physical quantity, but the results were not always the same answer?
The answer is because of the “Errors”.
There
are several types of errors influencing the accuracy of the measurements.
Barford,1985, stated that several sources of errors including
1.
Systemic errors
2.
Random errors
3.
Combinations of two random errors (number of significant figures)
4.
Human errors
Probability
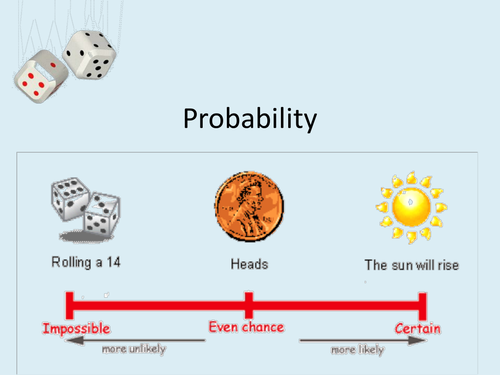
Events can be assigned probabilities vary from 0 up to 1. For example,
Events can be assigned probabilities vary from 0 up to 1. For example,
Some events in life are certain…. Human will die someday (1)
But some events are impossible ….an elephant can fly (0)
But some events are impossible ….an elephant can fly (0)
It is said that
probabilities close to 1 are quite likely to certain happening whereas probabilities
close to 0 are almost impossible.
In my opinion, I would conclude that the measurement of apparatus allow we know the precision and the value of the experiment much as much possible, but there are some errors present as barriers to obtain the precision and the true values, the probability displayed the chance of inaccuracy of the measurements by setting the level of confidence to ensure the level of error.
In my opinion, I would conclude that the measurement of apparatus allow we know the precision and the value of the experiment much as much possible, but there are some errors present as barriers to obtain the precision and the true values, the probability displayed the chance of inaccuracy of the measurements by setting the level of confidence to ensure the level of error.
ความคิดเห็น
แสดงความคิดเห็น